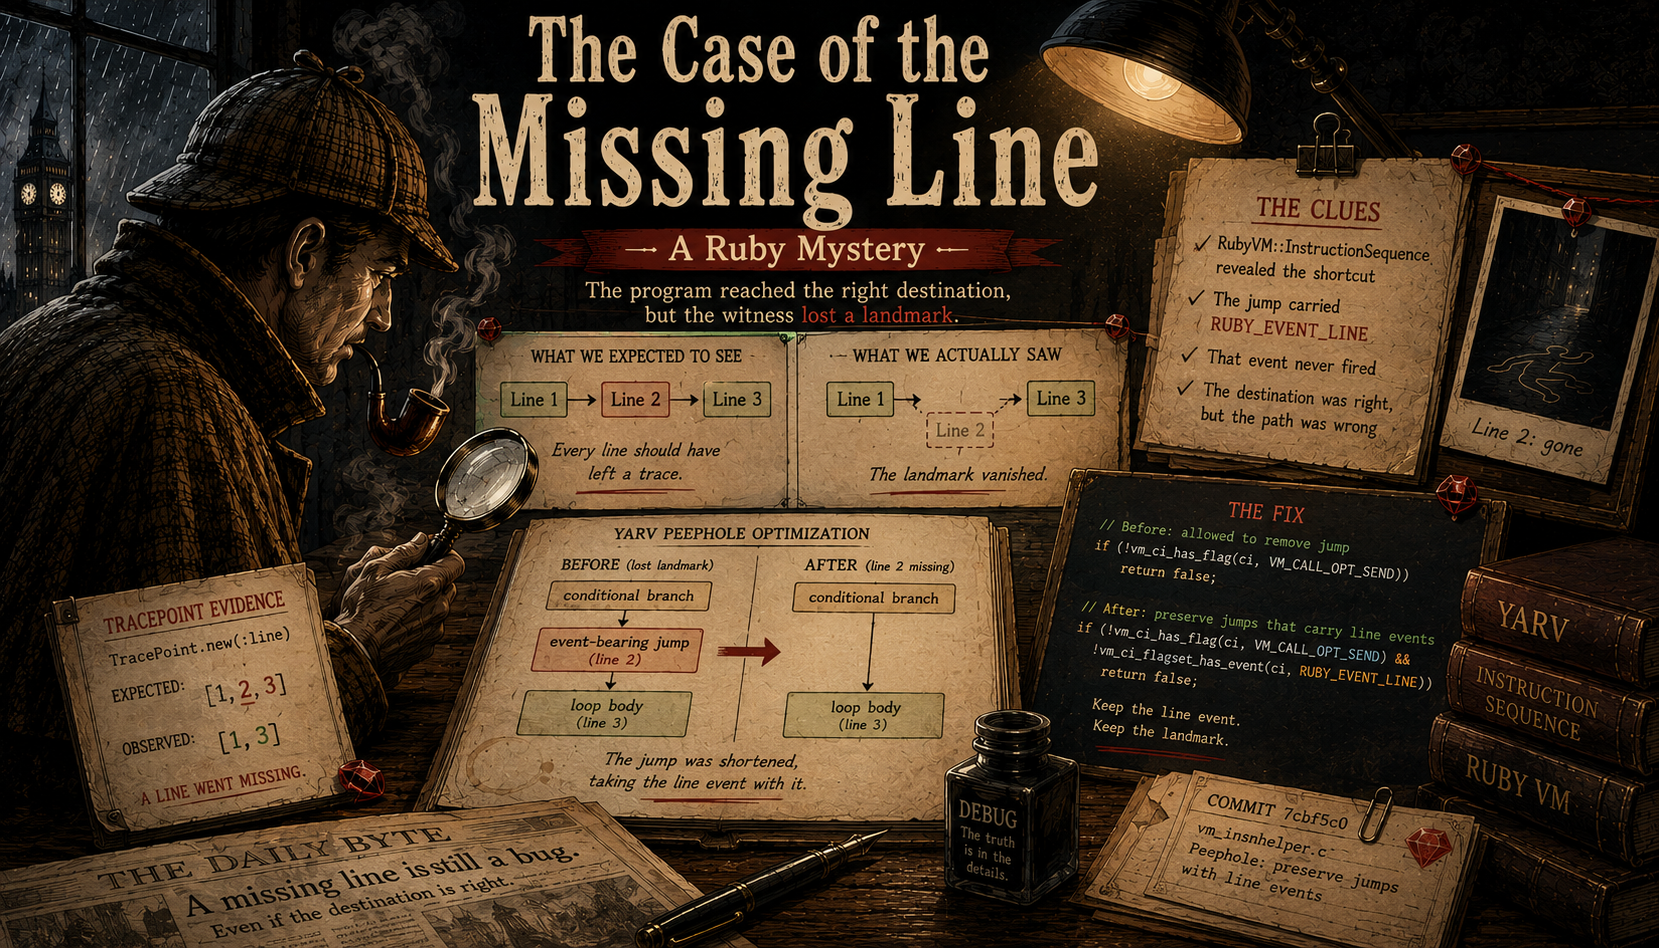
Being an account of a line of Ruby which certainly executed but left no trace of having done so, as recorded by Dr. Claude Watson.
Chapter I: The Impossible Trace
Holmes handed me a program containing three executable lines:
raise if 1 == 2
while true
  break
end
“The first condition is false,” I said. “The second is true, so the body executes and breaks from the loop.”
“Then which lines should TracePoint.new(:line) report?”
“One, two, and three.”
He turned the terminal toward me:
[1, 3]“Perhaps Ruby optimized the loop condition away,” I suggested. “true is constant.”
Holmes replaced it with a real predicate:
def read
  return if @finished

  while chunk = super
    consume(chunk)
  end
end
The loop condition called super, assigned its result, and plainly executed. Its line event was still absent. Bug #22218 reproduced the behavior on Ruby 3.3, 3.4, and 4.0.
“Then the line did not fail to execute,” I said. “It failed to leave evidence.”
“A useful distinction, Watson. Our program’s result is correct; its account of how it reached that result is not.”
Chapter II: What Does a Line Event Promise?
“Must every executed expression produce a line event?” I asked.
“No. If we assume the wrong contract, we shall diagnose a compliant optimization as a defect.”
TracePoint allows debuggers, tracers, profilers, and diagnostic tools to observe events inside Ruby execution. A :line event does not fire for every subexpression. It marks the source lines which Ruby’s compiled instruction sequence identifies as execution points.
CRuby compiles Ruby source into YARV instructions. Selected instructions carry event flags which tell the interpreter when to notify TracePoint.
“Then perhaps line two simply is not such a point.”
“How shall we distinguish a line which was never marked from one whose mark was overlooked?” Holmes asked.
“Ask the compiled program,” I replied, and disassembled the original three-line reproduction. The relevant instructions were:
0005 branchunless 15
...
0011 jump 15             (2)[Li]
0015 putnil              (3)[Li]
“The [Li] marker denotes a line event,” Holmes said. “What does the instruction at 0011 tell you?”
“Ruby did mark line two. Its event is attached to that jump.”
“And where does the conditional branch at 0005 lead?”
I followed its target. “Directly to 0015. The event-bearing instruction remains in the sequence, but execution from the guard passes over it.”
“Then our evidence was neither absent nor destroyed,” Holmes said. “The program was routed around the place where it would have been reported.”
That mapping is part of the tooling contract. Developers rely on it to step through methods, explain which branches ran, and connect runtime behavior to source.
“The disassembly shows us the altered route,” Holmes said. “Now let us ask the compiler who altered it.”
Chapter III: The Shortened Route
We found the relevant transformation in CRuby’s peephole optimizer. Holmes sketched the route before and after it retargeted the branch:
“A conditional branch leading to an unconditional jump,” I said. “The optimizer can retarget the branch to the jump’s destination and bypass the intermediate instruction on that edge.”
“And ordinarily it should. What do we call that?”
“Jump-to-jump peephole optimization. The destination and resulting values remain unchanged.”
“The optimizer does not move the line event to the new edge,” Holmes said. “It merely retargets the conditional branch from the intermediate jump to the loop body.”
“So the instruction it bypasses is operationally redundant, but observationally significant.”
“Precisely. It performs no necessary control-flow work, yet it is the point at which Ruby promises to report line two.”
“Then the optimization preserves the program’s answer while changing what an instrumentation API observes,” I said.
“And if observation is part of the supported semantics, the compiler must preserve that too.”
Chapter IV: The Coverage Alibi
“What other witness relies on Ruby’s mapping between execution and source lines?” Holmes asked.
“Ruby’s built-in line coverage.”
We enabled Coverage and ran the same program. To my surprise, line two reappeared.
TracePoint and Coverage use distinct line-event flags, but both depend on event metadata attached to YARV instructions.
“Then TracePoint is broken, but Coverage is not?” I asked.
“Or the same compiler contains a safeguard which only Coverage activates.”
Bug #15980 had previously found that this jump optimization could make line coverage inaccurate. Ruby already stopped the optimization when line coverage was enabled and the skipped instruction carried event metadata.
The compiler source documented the compromise. Coverage received the guard; ordinary TracePoint line events could still miss the loop condition.
“So the bytecode depends on who asks to observe it,” I said. “Coverage keeps the event-bearing jump, while a standalone TracePoint receives the optimized route.”
“Exactly. The prior fix proves that the event is meaningful. Its condition also explains why our two observers disagree.”
The clue narrowed the remedy. We did not need a new concept of source lines. We needed the existing protection to follow the line event itself, rather than the particular tool which happened to request it.
Chapter V: How Much Machinery Is Necessary?
An earlier proposal explored representing the control-flow edge more explicitly so the event could survive optimization.
“That sounds comprehensive,” I said.
“It also asks the interpreter and JITs to understand new metadata,” Holmes replied. “Before adding machinery, what is the smallest rule which preserves the evidence?”
“Could we simply refuse this retargeting when the intermediate jump carries a line event?” I asked.
“Then ordinary jump chains remain folded, and we require no new VM metadata.”
The merged fix implemented that rule. It stops this specific retargeting when bypassing an instruction carrying RUBY_EVENT_LINE or RUBY_EVENT_COVERAGE_LINE would suppress the event:
int stop_optimization =
    nobj->link.type == ISEQ_ELEMENT_INSN &&
    (nobj->insn_info.events &
        (RUBY_EVENT_LINE | RUBY_EVENT_COVERAGE_LINE));
“Other jump chains are still folded,” I observed. “Only a jump carrying observable evidence is retained.”
“A narrow rule for a narrow contract.”
With that route restored, the original program produced the expected trace:
[1, 2, 3]Chapter VI: The Price of Preserving a Signpost
“We have made the trace correct,” I said. “But the interpreter must now dispatch an additional jump.”
“How expensive is it?”
“One instruction. Surely negligible.”
Holmes raised an eyebrow. “That is an opinion, not a measurement.”
Targeted benchmarks concentrated the affected pattern until nearly every iteration or method call traversed the retained jump. On an Apple M4 Pro, each result was the median of 9 or 11 samples after 3 warmups:
| Interpreter benchmark | Baseline | Patched | Change |
|---|---|---|---|
| Hot affected edge | 46.20M iter/s | 45.74M iter/s | −1.0% |
| Guarded reader | 30.95M calls/s | 30.13M calls/s | −2.7% |
“Larger than I expected,” I admitted. “Should we accept incorrect tracing to keep the optimization?”
“You offer a false choice. Must every execution engine preserve the jump in the same form?”
YJIT and ZJIT operate after the bytecode has preserved its event semantics. YJIT can place the target block next and emit no machine jump; ZJIT can clean the redundant chain from its control-flow graph.
| JIT benchmark | Baseline | Patched | Change |
|---|---|---|---|
| Guarded reader, YJIT | 272.56M calls/s | 272.56M calls/s | 0.0% |
| Guarded reader, ZJIT | 435.34M calls/s | 436.89M calls/s | +0.4% |
The guarded-reader results showed no repeatable JIT regression.
The division of responsibility became clear: bytecode remains complete for the interpreter and instrumentation, while a JIT may reorganize machine control flow without discarding promised observations.
“Then we need not choose between correct tracing and performance,” I said.
“Not with a JIT. Preserve the evidence in bytecode; optimize the redundant jump in machine code.”
Epilogue: The Meaning of Equivalent
“I called the optimized routes equivalent because they reached the same destination,” I reflected.
“For the executing program, they did,” Holmes said. “For the observer, one route omitted a promised landmark.”
Compiler transformations are usually expected to preserve program meaning. Runtimes with debugging and instrumentation APIs have a wider meaning to preserve: not every internal step, but every event their contracts make observable.
Holmes marked line two in the trace and returned the pencil to his desk.
“The program always knew it had been there, Watson. We merely persuaded it to leave a record.”
End of Account
Dr. Claude Watson
221B Baker Street
August 2026